Studying images in social media poses specific methodological challenges, which in turn have directed scholarly attention towards the computational interpretation of visual data. When analyzing large numbers of images, both traditional content analysis as well as cultural analytics have proven valuable. However, these techniques do not take into account the circulation and contextualization of images within a socio-technical environment. As the meaning of social media images is co-created by networked publics, bound through networked practices, these visuals should be analyzed on the level of their networked contextualization. Although machine vision is increasingly adept at recognizing faces and features, its performance in grasping the meaning of social media images is limited. However, combining automated analyses of images - broken down by their compositional elements - with repurposing platform data opens up the possibility to study images in the context of their resonance within and across online discursive spaces. This paper explores the capacities of platform data - hashtag modularity and retweet counts - to complement the automated assessment of social media images; doing justice to both the visual elements of an image and the contextual elements encoded by networked publics that co-create meaning.
MULTIFILE

This paper introduces the open-source Urban Belonging (UB) toolkit, designed to study place attachments through a combined digital, visual and participatory methodology that foregrounds lived experience. The core of the toolkit is the photovoice UB App, which prompts participants to document urban experiences as digital data by taking pictures of the city, annotating them, and reacting to others’ photos. The toolkit also includes an API interface and a set of scripts for converting data into visualizations and elicitation devices. The paper first describes how the app’s design specifications were co-created in a process that brought in voices from different research fields, planners from Gehl Architects, six marginalized communities, and citizen engagement professionals. Their inputs shaped decisions about what data collection the app makes possible, and how it mitigates issues of privacy and visual and spatial literacy to make the app as inclusive as possible. We document how design criteria were translated into app features, and we demonstrate how this opens new empirical opportunities for community engagement through examples of its use in the Urban Belonging project in Copenhagen. While the focus on photo capture animates participants to document experiences in a personal and situated way, metadata such as location and sentiment invites for quali-quantitative analysis of both macro trends and local contexts of people’s experiences. Further, the granularity of data makes both a demographic and post-demographic analysis possible, providing empirical ground for exploring what people have in common in what they photograph and where they walk. And, by inviting participants to react to others’ photos, the app offers a heterogeneous empirical ground, showing us how people see the city differently. We end the paper by discussing remaining challenges in the tool and provide a short guide for using it.
DOCUMENT

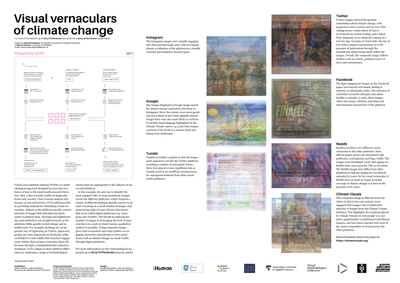
Visual cross-platform analysis (VCPA) is a methodological approach designed to overcome two forms of bias in the social media research literature: first, a bias towards studies of single plat- forms and, second, a bias towards analysis that focuses on text and metrics. VCPA addresses this by providing methods for identifying visual vernaculars, defined as the platform-specific content and style of images that articulate any given social or political issue.
IMAGE
Background: Digital health is well-positioned in low and middle-income countries (LMICs) to revolutionize health care due, in part, to increasing mobile phone access and internet connectivity. This paper evaluates the underlying factors that can potentially facilitate or hinder the progress of digital health in Pakistan. Objective: The objective of this study is to identify the current digital health projects and studies being carried out in Pakistan, as well as the key stakeholders involved in these initiatives. We aim to follow a mixed-methods strategy and to evaluate these projects and studies through a strengths, weaknesses, opportunities, and threats (SWOT) analysis to identify the internal and external factors that can potentially facilitate or hinder the progress of digital health in Pakistan. Methods: This study aims to evaluate digital health projects carried out in the last 5 years in Pakistan with mixed methods. The qualitative and quantitative data obtained from field surveys were categorized according to the World Health Organization’s (WHO) recommended building blocks for health systems research, and the data were analyzed using a SWOT analysis strategy. Results: Of the digital health projects carried out in the last 5 years in Pakistan, 51 are studied. Of these projects, 46% (23/51) used technology for conducting research, 30% (15/51) used technology for implementation, and 12% (6/51) used technology for app development. The health domains targeted were general health (23/51, 46%), immunization (13/51, 26%), and diagnostics (5/51, 10%). Smartphones and devices were used in 55% (28/51) of the interventions, and 59% (30/51) of projects included plans for scaling up. Artificial intelligence (AI) or machine learning (ML) was used in 31% (16/51) of projects, and 74% (38/51) of interventions were being evaluated. The barriers faced by developers during the implementation phase included the populations’ inability to use the technology or mobile phones in 21% (11/51) of projects, costs in 16% (8/51) of projects, and privacy concerns in 12% (6/51) of projects.
DOCUMENT

Mapping Microplastics was a first exploratory workshop (part of the Entrepreneurship Program at HvA) with researchers and entrepreneurs to map how the public discourse on microplastics develops on Twitter.The preparation of this workshop followed a hybrid approach in three steps: preliminary mapping, joint interpretation and annotation, map redesign and feedback. The preliminary mapping was performed by designing a query to collect tweets around the topic of Microplastics. To perform the data collection and preliminary analysis we used TCAT (Twitter Capturing and Analysis Toolset), a tool developed by the Digital Methods Initiative at the University of Amsterdam. A set of four maps was designed to address different sub questions through different visual models: networks of hashtags and users, image grids organized by time and frequency, alluvial diagrams and lists of most interacted with tweets. These maps were used in a joint interpretative hybrid session: the visual material was printed and sent to each partner. With the facilitation of designers and researchers, entrepreneurs annotated the printed maps in parallel online sessions.
DOCUMENT
The visual representation of Information System (IS) artefacts is an important aspect in the practical application of visual representations. However, important and known visual representation principles are often undervalued, which could lead to decreased effectiveness in using a visual representation. Decision Management (DM) is one field of study in which stakeholders must be able to utilize visual notations to model business decisions and underlying business logic, which are executed by machines, thus are IS artefacts. Although many DM notations currently exist, little research actually evaluates visual representation principles to identify the visual notations most suitable for stakeholders. In this paper, the Physics of Notations framework of Moody is operationalized and utilized to evaluate five different DM visual notations. The results show several points of improvement with regards to these visual notations. Furthermore, the results could show the authors of DM visual notations that well-known visual representation principles need to be adequately taken into account when defining or modifying DM visual notations.
DOCUMENT

In an image-saturated society, methods for visual analysis gain urgency. This special issue explores visual ways to study online images, focusing on their collection and circulation. The proposition we make is to stay as close to the material as possible. How to approach the visual with the visual? What type of images may one design to make sense of, reshape, and reanimate online image collections? How may arrangements of online images promote various analytical procedures, participatory actions, and design interventions? Furthermore, we focus on the role that algorithmic tools, including machine vision, can play in such research efforts while being sensitive to their flaws and shortcomings. Which kinds of collaborations between humans and machines can we envision to better grasp and critically interrogate the dynamics of today’s digital visual culture? The different practices and formats discussed in this special issue (including data feminism, visual scores, machine vision, image networks, field guides) offer a range of approaches that seek to understand, reanimate, and change perspectives on our digital visual culture.
MULTIFILE

Studying images on social media introduces several challenges that relate to the size of datasets and the different meaning-making grammars of social visuality; or as aptly pointed out by others in the field, it means ‘studying the qualitative on a quantitative scale’. Although cultural analytics provides an automated process through which patterns can be detected in large numbers of images, this methodology doesn’t account for other modalities of the image than the image itself. However, images circulating social media can (and should) be analyzed on the level of their audience as the latter is co-creating the meaning of images. Bridging the study of platform affordances and affect theory, this paper presents a novel methodology that repurposes Facebook Reactions to infer collective attitudes and performative emotional expressions vis á vis images shared on the large Syrian Revolution Network public page (+2M). We found visual patterns that co-occur with certain collective combinations of buttons, displaying how socio-technical features shape the discursive frameworks of online publics.
MULTIFILE
Aim: There is often a gap between the ideal of involving older persons iteratively throughout the design process of digital technology, and actual practice. Until now, the lens of ageism has not been applied to address this gap. The goals of this study were: to voice the perspectives and experiences of older persons who participated in co-designing regarding the design process; their perceived role in co-designing and intergenerational interaction with the designers; and apparent manifestations of ageism that potentially influence the design of digital technology. Methods: Twenty-one older persons participated in three focus groups. Five themes were identified using thematic analysis which combined a critical ageism ‘lens’ deductive approach and an inductive approach. Results: Ageism was experienced by participants in their daily lives and interactions with the designers during the design process. Negative images of ageing were pointed out as a potential influencing factor on design decisions. Nevertheless, positive experiences of inclusive design pointed out the importance of “partnership” in the design process. Participants defined the “ultimate partnership” in co-designing as processes in which they were involved from the beginning, iteratively, in a participatory approach. Such processes were perceived as leading to successful design outcomes, which they would like to use, and reduced intergenerational tension. Conclusions: This study highlights the potential role of ageism as a detrimental factor in how digital technologies are designed. Viewing older persons as partners in co-designing and aspiring to more inclusive design processes may promote designing technologies that are needed, wanted and used.
DOCUMENT

The importance of leadership is increasingly recognized in relation to digital transformation. Therefore, middle management and top management must have the competencies required to lead such a transformation. The purpose of this paper is to investigate the relationship between the digital leader competencies as set out by the European e-competence framework (e-CF) and the digital transformation of organizations. Also, the relationship between digital leadership competency (DLC) and IT capability is examined. An empirical investigation is presented based on a sample of 433 respondents, analyzed using PLS-SEM. The results strongly support our hypotheses. DLC has a strong impact on organizational digital transformation. A post-hoc analysis showed this is predominantly the case for the e-CF competencies of business plan development, architecture design, and innovating while business change management and governance do not seem to affect organizational digital transformation. This is the first empirical study to conceptualize, operationalize and validate the concept of DLC, based on the e-competence framework, and its impact on digital transformation. These findings have significant implications for researchers and practitioners working on the transformation toward a digital organization.
MULTIFILE

