In de afgelopen twee jaar is veel veranderd op juridisch vlak als het gaat om de rechtspositie van de consument en diens aansluiting op het aardgassysteem. In deze bijdrage verkennen we de juridische mogelijkheden én onmogelijkheden van twee uitgangsposities: a. die van de burger die graag zelf actie wil ondernemen om van het gas af te gaan en b. die van de gasklever, oftewel de burger die wil vasthouden aan het gas omdat hij geen heil ziet in de energietransitie, de alternatieve voorziening geen verbetering of te duur is, diens huis niet geschikt is voor een warmtepomp of omdat hij de woning volledig op elektriciteit wil. In dit laatste geval wordt vervolgens uiteengezet in hoeverre de gastrouwe burger gedwongen kan worden onder huidig en toekomstig recht toch de overstap te maken naar een energievoorziening zonder aardgas. Voor de uiteenzetting van deze uitgangsposities wordt kort de achtergrond van de warmtetransitie geschetst en de manier waarop deze via de transitievisie warmte, met de gemeente aan kop, tot stand moet gaan komen. Het Wetsvoorstel gemeentelijke instrumenten warmtetransitie wordt hier tevens besproken.
LINK
In 2004 the report Intellectual capital of the European Union was published (Andriessen and Stam, 2004). This report provided insight in the value of the intellectual capital of the 15 countries of the European Union, in relationship to the goals set by the European Council in March 2000. Since this report, the EU grew from 15 to 27 countries and the Lisbon goals were reformulated in 2005. The aim of this paper is to repeat the measurement of the intellectual capital (IC) of the enlarged European Union (EU) in relationship to the new Lisbon goals. In order to become the most competitive and dynamic knowledge-based economy, the EU decided to focus on “delivering stronger, lasting growth and creating more and better jobs” (CEC, 2005d, p.7). In this paper we translate this overall goal in 38 indicators. As the data was not available for all the new member states, we decided to limit our paper to the so-called EU-19. Based on our measurements we conclude that the EU-19 is still behind Japan and far behind the USA, however the EU is catching up as both Japan and the USA have considerably lower growth figures than the EU-19. From an IC perspective, the EU is geographically divided. The Nordic countries are still the best performing countries. The southern European countries and the new member states stay behind. However, as the new member states invest more in their IC, it might be expected that their positions will improve in the future. The aim of our paper was to measure the progress of the Lisbon Agenda for growth and jobs. Based on our measurements we conclude that the EU-19 is successful in terms of creating more and better jobs, but not successful in terms of delivering stronger, lasting growth.
DOCUMENT

Purpose: Lactate is an established prognosticator in critical care. However, there still is insufficient evidence about its role in predicting outcome in COVID-19. This is of particular concern in older patients who have been mostly affected during the initial surge in 2020. Methods: This prospective international observation study (The COVIP study) recruited patients aged 70 years or older (ClinicalTrials.gov ID: NCT04321265) admitted to an intensive care unit (ICU) with COVID-19 disease from March 2020 to February 2021. In addition to serial lactate values (arterial blood gas analysis), we recorded several parameters, including SOFA score, ICU procedures, limitation of care, ICU- and 3-month mortality. A lactate concentration ≥ 2.0 mmol/L on the day of ICU admission (baseline) was defined as abnormal. The primary outcome was ICU-mortality. The secondary outcomes 30-day and 3-month mortality. Results: In total, data from 2860 patients were analyzed. In most patients (68%), serum lactate was lower than 2 mmol/L. Elevated baseline serum lactate was associated with significantly higher ICU- and 3-month mortality (53% vs. 43%, and 71% vs. 57%, respectively, p < 0.001). In the multivariable analysis, the maximum lactate concentration on day 1 was independently associated with ICU mortality (aOR 1.06 95% CI 1.02–1.11; p = 0.007), 30-day mortality (aOR 1.07 95% CI 1.02–1.13; p = 0.005) and 3-month mortality (aOR 1.15 95% CI 1.08–1.24; p < 0.001) after adjustment for age, gender, SOFA score, and frailty. In 826 patients with baseline lactate ≥ 2 mmol/L sufficient data to calculate the difference between maximal levels on days 1 and 2 (∆ serum lactate) were available. A decreasing lactate concentration over time was inversely associated with ICU mortality after multivariate adjustment for SOFA score, age, Clinical Frailty Scale, and gender (aOR 0.60 95% CI 0.42–0.85; p = 0.004). Conclusion: In critically ill old intensive care patients suffering from COVID-19, lactate and its kinetics are valuable tools for outcome prediction. Trial registration number: NCT04321265.
DOCUMENT
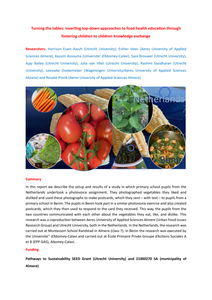
In this report we describe the setup and results of a study in which primary school pupils from the Netherlands undertook a photovoice assignment. They photographed vegetables they liked and disliked and used these photographs to make postcards, which they sent – with text – to pupils from a primary school in Benin. The pupils in Benin took part in a similar photovoice exercise and also created postcards, which they then used to respond to the card they received. This way, the pupils from the two countries communicated with each other about the vegetables they eat, like, and dislike.
DOCUMENT