By use of a literature review and an environmental scan four plausible future scenarios will be created, based on the research question: How could the future of backpack tourism look like in 2030, and how could tourism businesses anticipate on the changing demand. The scenarios, which allow one to ‘think out of the box’, will eventually be translated into recommendations towards the tourism sector and therefore can create a future proof company strategy.
DOCUMENT

This article explores the use of design thinking as a method to develop scenario for the future of hotels. Using a Dutch case study, this article shows how a new concept for hotels – the Lifestyle Hub – was created using design thinking as methodology. The Lifestyle Hub concept provides ingredients to hotel owners as well as public policymakers to help understand how future guests may expect to make use of individually tailored hospitable facilities in destinations around the world. Moreover, design thinking allows researchers and businesses to generate highly differentiated customer-centred, experience-based business concepts, thus adding to the toolkit of futures researchers. We conclude that design thinking provides new insights for hospitality and tourism and presents a valuable alternative to current future scenarios approaches.
LINK
Completeness of data is vital for the decision making and forecasting on Building Management Systems (BMS) as missing data can result in biased decision making down the line. This study creates a guideline for imputing the gaps in BMS datasets by comparing four methods: K Nearest Neighbour algorithm (KNN), Recurrent Neural Network (RNN), Hot Deck (HD) and Last Observation Carried Forward (LOCF). The guideline contains the best method per gap size and scales of measurement. The four selected methods are from various backgrounds and are tested on a real BMS and metereological dataset. The focus of this paper is not to impute every cell as accurately as possible but to impute trends back into the missing data. The performance is characterised by a set of criteria in order to allow the user to choose the imputation method best suited for its needs. The criteria are: Variance Error (VE) and Root Mean Squared Error (RMSE). VE has been given more weight as its ability to evaluate the imputed trend is better than RMSE. From preliminary results, it was concluded that the best K‐values for KNN are 5 for the smallest gap and 100 for the larger gaps. Using a genetic algorithm the best RNN architecture for the purpose of this paper was determined to be GatedRecurrent Units (GRU). The comparison was performed using a different training dataset than the imputation dataset. The results show no consistent link between the difference in Kurtosis or Skewness and imputation performance. The results of the experiment concluded that RNN is best for interval data and HD is best for both nominal and ratio data. There was no single method that was best for all gap sizes as it was dependent on the data to be imputed.
MULTIFILE

Completeness of data is vital for the decision making and forecasting on Building Management Systems (BMS) as missing data can result in biased decision making down the line. This study creates a guideline for imputing the gaps in BMS datasets by comparing four methods: K Nearest Neighbour algorithm (KNN), Recurrent Neural Network (RNN), Hot Deck (HD) and Last Observation Carried Forward (LOCF). The guideline contains the best method per gap size and scales of measurement. The four selected methods are from various backgrounds and are tested on a real BMS and meteorological dataset. The focus of this paper is not to impute every cell as accurately as possible but to impute trends back into the missing data. The performance is characterised by a set of criteria in order to allow the user to choose the imputation method best suited for its needs. The criteria are: Variance Error (VE) and Root Mean Squared Error (RMSE). VE has been given more weight as its ability to evaluate the imputed trend is better than RMSE. From preliminary results, it was concluded that the best K‐values for KNN are 5 for the smallest gap and 100 for the larger gaps. Using a genetic algorithm the best RNN architecture for the purpose of this paper was determined to be Gated Recurrent Units (GRU). The comparison was performed using a different training dataset than the imputation dataset. The results show no consistent link between the difference in Kurtosis or Skewness and imputation performance. The results of the experiment concluded that RNN is best for interval data and HD is best for both nominal and ratio data. There was no single method that was best for all gap sizes as it was dependent on the data to be imputed.
DOCUMENT

This paper presents four Destination Stewardship scenarios based on different levels of engagement from the public and private sector. The scenarios serve to support destination stakeholders in assessing their current context and the pathway towards greater stewardship. A Destination Stewardship Governance Diagnostic framework is built on the scenarios to support its stakeholders in considering how to move along that pathway, identifying the key aspects of governance that are either facilitating or frustrating a destination stewardship approach, and the required actions and resources to achieve an improved scenario. Moreover, the scenarios and diagnostic framework support stakeholders to come together to debate and scrutinise how tourism is managed in a way that meets the needs of the destination, casting new light on the barriers and opportunities for greater destination stewardship.
DOCUMENT

Introduction (author supplied) : In this paper we propose future mapping, an alternative approach to futures research. With future mapping we intend to overcome some of the main problems that we encountered when applying scenario thinking in the area of product design and innovation. Future mapping attempts to develop multi-layered maps of possible futures, which can be used by pro-active companies and innovation teams as an instrument to ‘navigate’ the future (Munnecke & Van der Lugt, 2006). The approach invites designers to apply their analytical, creative and emphatical skills in a dialogue about future opportunities that lay ahead. In the past few years we have taught and applied the future mapping approach with various groups of Master’s level engineering students, both in The Netherlands and Denmark. We have altered and adjusted the approach as we learned from these experiences. In this paper we will describe the current state of the approach. The paper is not meant to provide a deep theoretical overview or a thorough empirical study. Rather it is meant to provide a hands-on process description to inform about the method and to enable anyone to apply future mapping. After describing why we think future mapping is a promising direction for futures research, we will provide a concise overview of the process steps involved. Then we will describe one student project as a case example. We will discuss the various types of future maps produced by the students. We will conclude by making some general observations about using future mapping as a method for futures research, and by proposing some directions for future work.
DOCUMENT

MULTIFILE
This study presents an automated method for detecting and measuring the apex head thickness of tomato plants, a critical phenotypic trait associated with plant health, fruit development, and yield forecasting. Due to the apex's sensitivity to physical contact, non-invasive monitoring is essential. This paper addresses the demand for automated, contactless systems among Dutch growers. Our approach integrates deep learning models (YOLO and Faster RCNN) with RGB-D camera imaging to enable accurate, scalable, and non-invasive measurement in greenhouse environments. A dataset of 600 RGB-D images captured in a controlled greenhouse, was fully preprocessed, annotated, and augmented for optimal training. Experimental results show that YOLOv8n achieved superior performance with a precision of 91.2 %, recall of 86.7 %, and an Intersection over Union (IoU) score of 89.4 %. Other models, such as YOLOv9t, YOLOv10n, YOLOv11n, and Faster RCNN, demonstrated lower precision scores of 83.6 %, 74.6 %, 75.4 %, and 78 %, respectively. Their IoU scores were also lower, indicating less reliable detection. This research establishes a robust, real-time method for precision agriculture through automated apex head thickness measurement.
DOCUMENT
In this paper, we explore the design of web-based advice robots to enhance users' confidence in acting upon the provided advice. Drawing from research on algorithm acceptance and explainable AI, we hypothesise four design principles that may encourage interactivity and exploration, thus fostering users' confidence to act. Through a value-oriented prototype experiment and value-oriented semi-structured interviews, we tested these principles, confirming three of them and identifying an additional principle. The four resulting principles: (1) put context questions and resulting advice on one page and allow live, iterative exploration, (2) use action or change oriented questions to adjust the input parameters, (3) actively offer alternative scenarios based on counterfactuals, and (4) show all options instead of only the recommended one(s), appear to contribute to the values of agency and trust. Our study integrates the Design Science Research approach with a Value Sensitive Design approach.
MULTIFILE

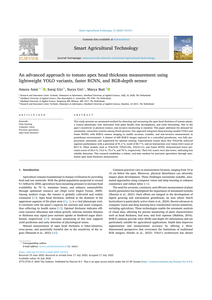
Om goed in te spelen op complexe ontwikkelingen in onze snel veranderende samenleving, hebben organisaties hulp en handvatten nodig. In dit artikel wordt daartoe een driestapsaanpak beschreven voor het inzetten van toekomstscenario’s bij strategievorming: identificeren van drivers for change; toekomstscenario’s creëren en toekomstscenario’s toepassen. Deze aanpak is in de praktijk toegepast, drie van deze praktijkcases worden hier beschreven: ‘Grafimedia 3.0’; ‘The food after tomorrow’ en ‘Een leefbare stad Eindhoven 2030’. Op basis van de resultaten uit deze cases en de verschillen en overeenkomsten ertussen kunnen de volgende aanbevelingen worden gegeven: de tijdshorizon van de toekomstscenario’s moet aansluiten bij de urgentie van de opdrachtgever; adequate begeleiding bij het toepassen van de toekomstscenario’s is onmisbaar en het is belangrijk om actief te zijn in het verbeelden van de toekomst, voor zowel de makers van de toekomstscenario’s als voor de opdrachtgever. In order to comply with the complex and rapid developments of our society when directing an organization, policymakers need help and guidance. To offer these, this article describes a three-step approach for using future scenarios in strategy development: the identification of drivers for change, the creation of future scenarios and the practical application of these future scenarios. This approach has been used in real life and three of these cases are described here: ‘Grafimedia 3.0’; ‘The food after tomorrow’ and ‘Een leefbare stad Eindhoven 2030’ (‘A livable Eindhoven in 2030’). The following recommendations can be derived based on the case results and their differences and similarities: the time scale of the future scenarios should match the urgency of the client’s situation, adequate tutoring in the practical application of the future scenarios is essential and, lastly, it is important, not only for the creators of the future scenarios but also for the client, to imagine the future in an active fashion.
DOCUMENT